Tankers 2022 review
The main story for tankers in 2022 has been the Russia Ukraine war, SPR releases and Chinese lockdowns:
The Russia Ukraine war increased ton mile demand by 1) rerouting EU bound crude and product for Asian demand, 2) rerouting EU bound crude for Asian and other refineries to be refined and sold back to EU, 3) redirecting alternative sources of crude and product to EU to substitute Russian barrels and 4) encouraging deceptive shipping practices that lead to inefficient shipping through the use of ship to ship transfers, oil reblending, transferring of oil tankers to an illicit fleet, etc. EU officially banned Russian crude on Dec 5, and will fully ban product on Feb 5.
US undertook an SPR release due to high oil prices, some of which made its way overseas via trans Pacific or trans Atlantic routes, which increased ton mile demand.
Chinese lockdowns reduced Chinese oil demand and had a dampening effect on ton mile demand.
Miscellaneous factors, which I can’t list exhaustively here (I am a retail generalist), such as the shutdown of 3 mbpd of capacity in US Gulf refineries last year, due to severe weather, which has greatly affected product, especially MR rates.
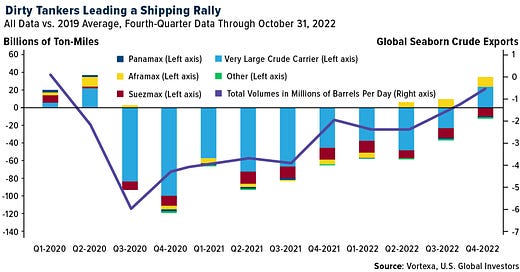
The ton mile demand increase has been a slow, secular trend (Figure 1).
And the net effect has been an increase in both the Baltic Clean (Figure 2) and Dirty (Figure 3) tanker indices throughout 2022.
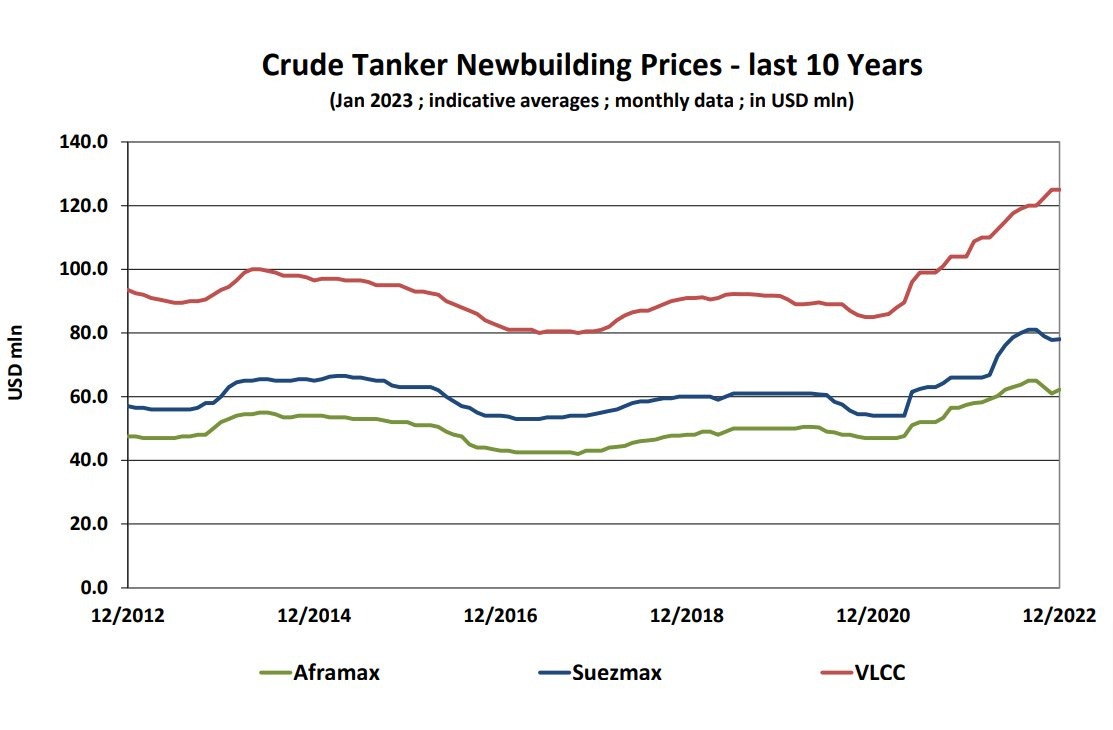
Correspondingly, asset values have increased (Figure 4, Figure 5, Figure 6 - LR2 is product tanker).
Where are we headed for 2023, and what are the equities pricing in?
Demand update
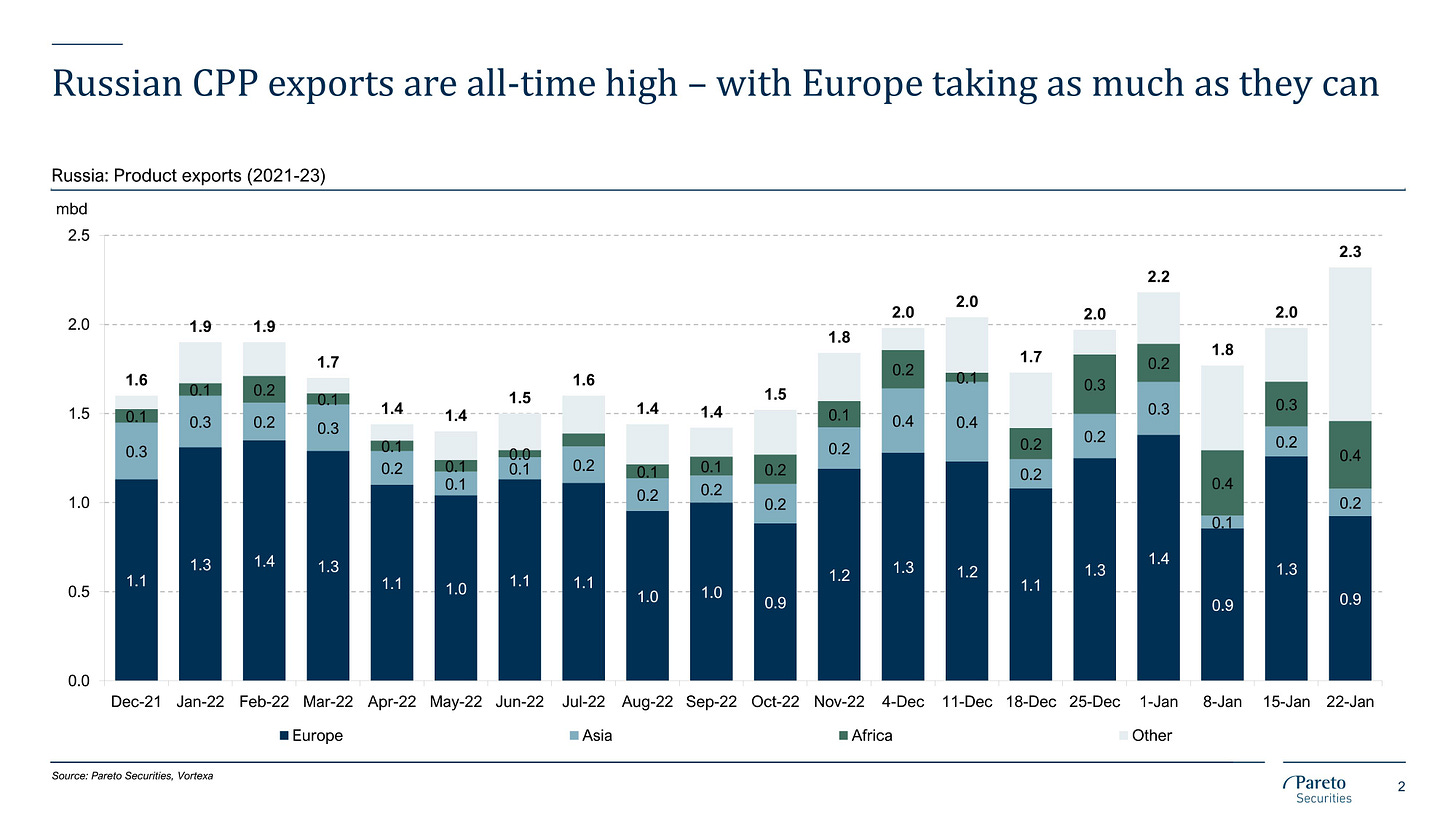
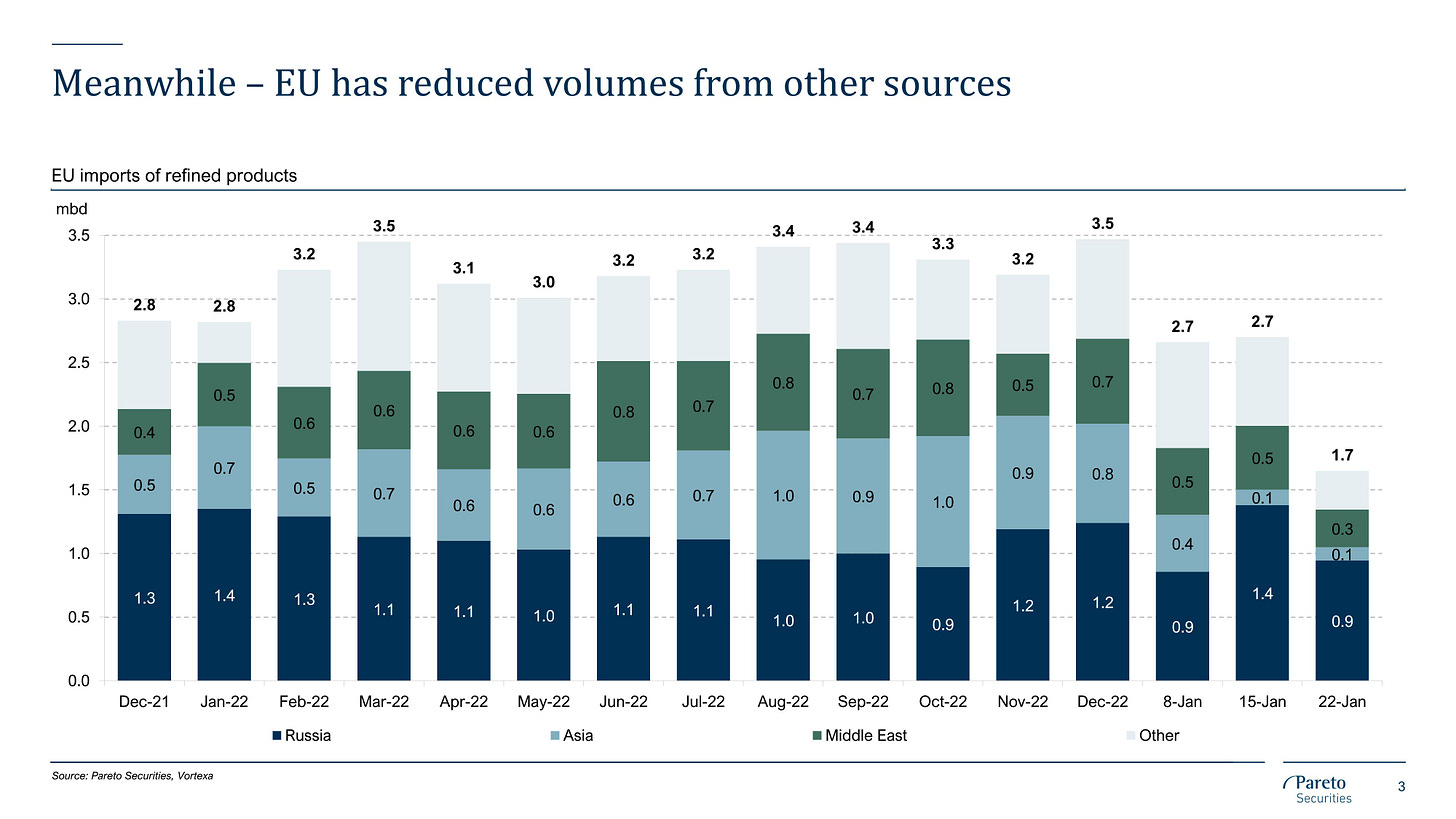
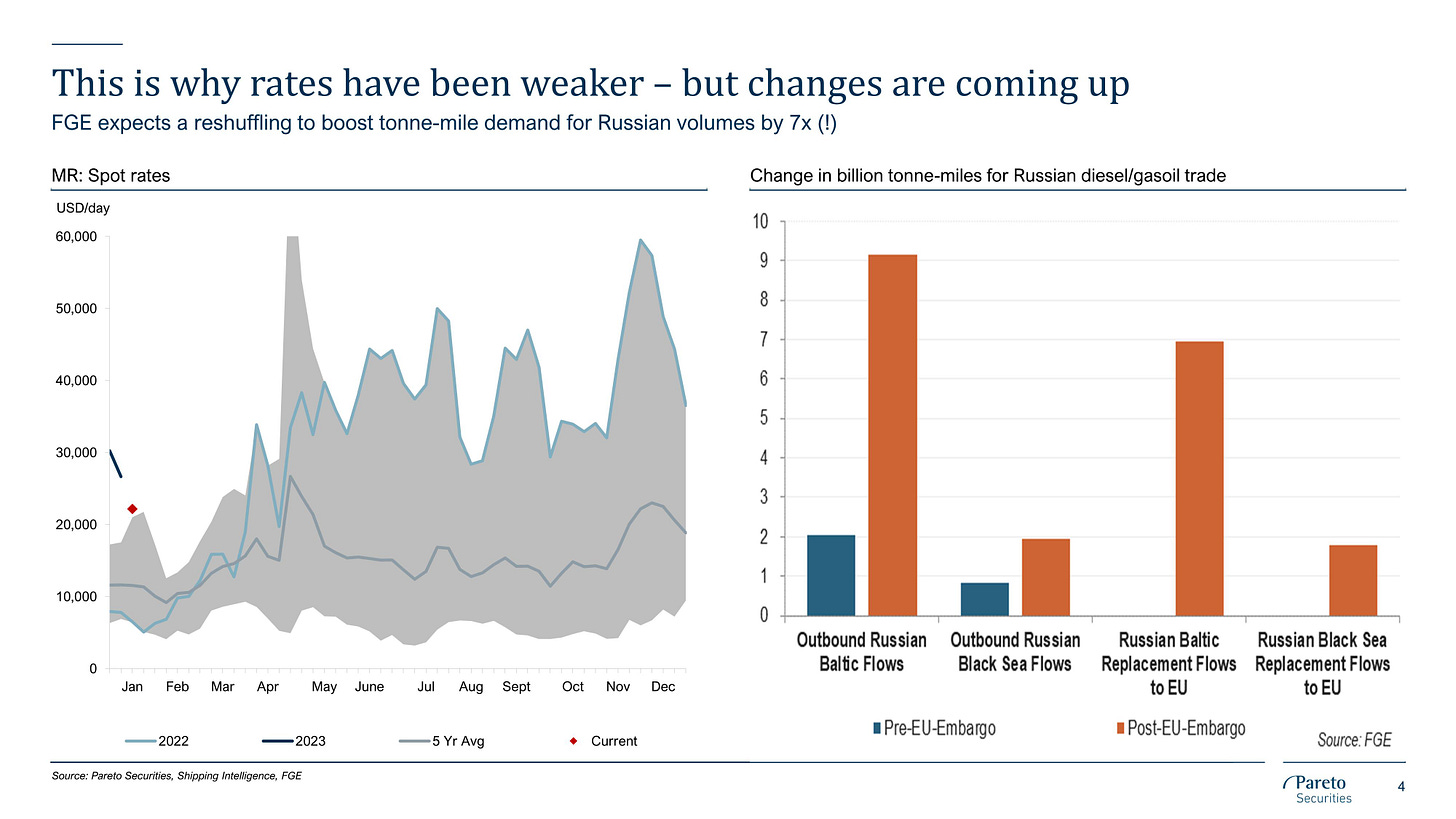
The first consideration is the impact of the Russia Ukraine war on ton mile demand. My guess is that the complete rerouting of the trade routes has not occurred yet, as the product ban, which will ban all product imports from Russia, has not even come into effect yet (February 5). As to how many product ton miles remains to be gleaned from this rerouting, I can’t say precisely. The shipping industry is complex, and the market also responds to price, and it’s hard to assess where the feedback loop ends. But there is still some juice left in this trend. In Jan 2023, China has raised export quotas for refined oil products. And Europe is still consuming a substantial amount of clean product, and has in fact reduced volume from other sources. The ban on February 5 would force them to import from further places (they are still importing ~1.1mbpd - Figure 7, and it is by substituting other sources with Russian sources, probably to hoard before the ban - Figure 8), and redirect some of current Russian product to further locations (some expect this to boost ton mile for Russian volume by 7x - but I would discount this - Figure 9). We are already seeing Russian product being increasingly exported to further locations (Figure 10). The ban would also ban European ships from touching Russian product, which would reduce ship supply and lead to more of the inefficient oil transport practices we are already seeing. Meanwhile, rerouting of crude trade routes is continuing, with Europe continuing to reduce crude imports (Figure 11). The main risk here is a cessation of the war and reversal of the rerouting, but even that would take time.
The second consideration is the impact of the Chinese reopening. The impact on global oil demand and ton miles is likely to be substantial. As per Pierre Andurand, we are below trend for global oil demand. If we revert back to trend, the impact would be an increase of 4.6 mbpd vs 2022 (Figure 12). The advent of EVs may reduce demand by 600k bpd. The impact of a recession will be substantial, but oil demand tends to be robust to recessions of the non pandemic kind, as shown in the chart from 2007-2009. I expect at least a 1-2 mbpd increase next year, most of which will translate into seaborne imports (since the main marginal buyer due to the reopening is likely China, which imports oil due to lack of domestic production and has already tapped its pipeline sources).
Supply update
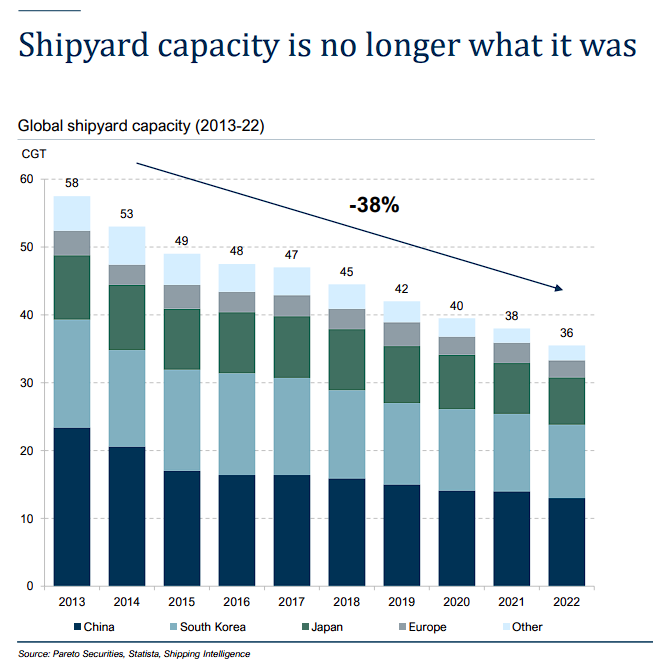
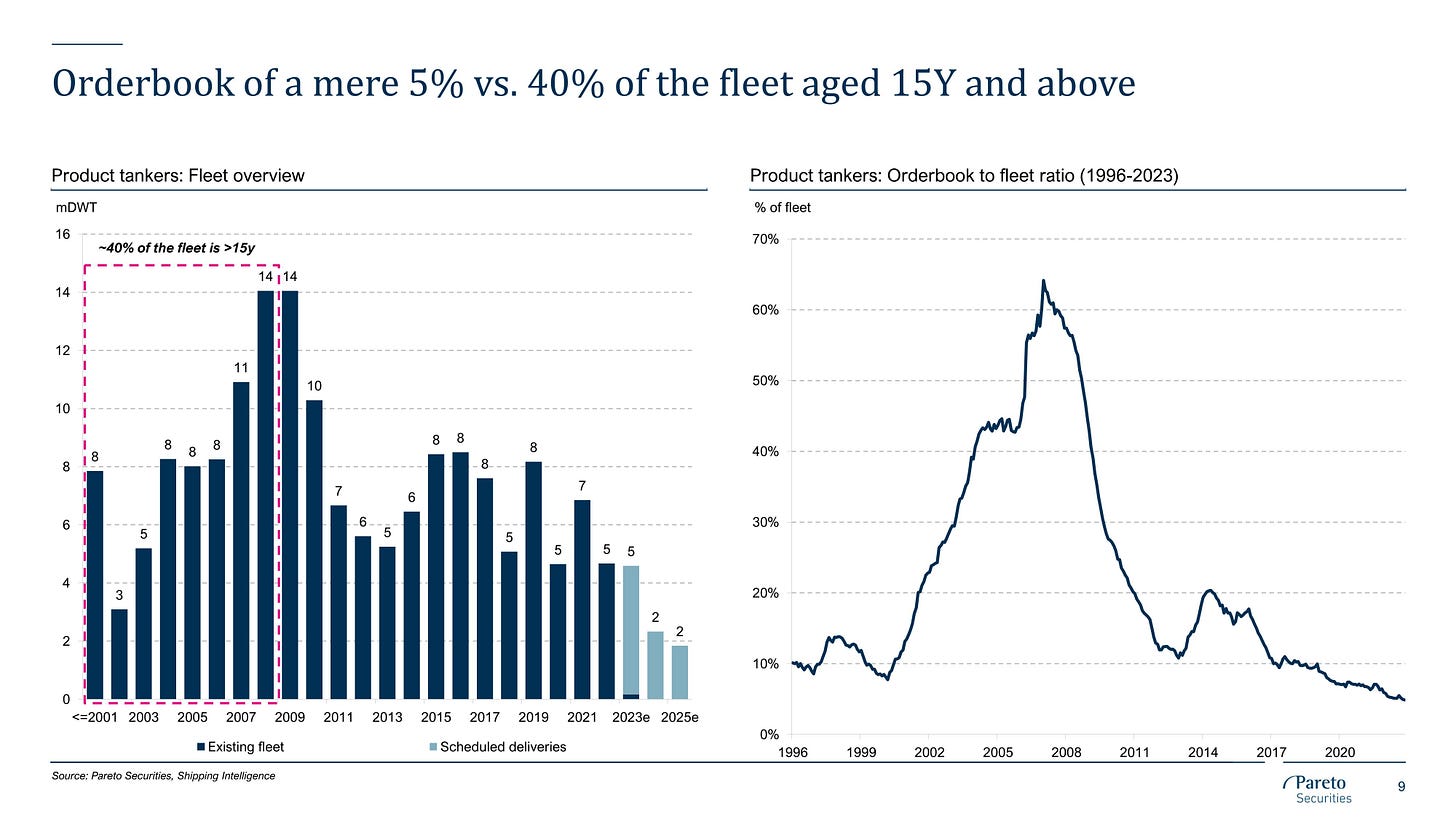
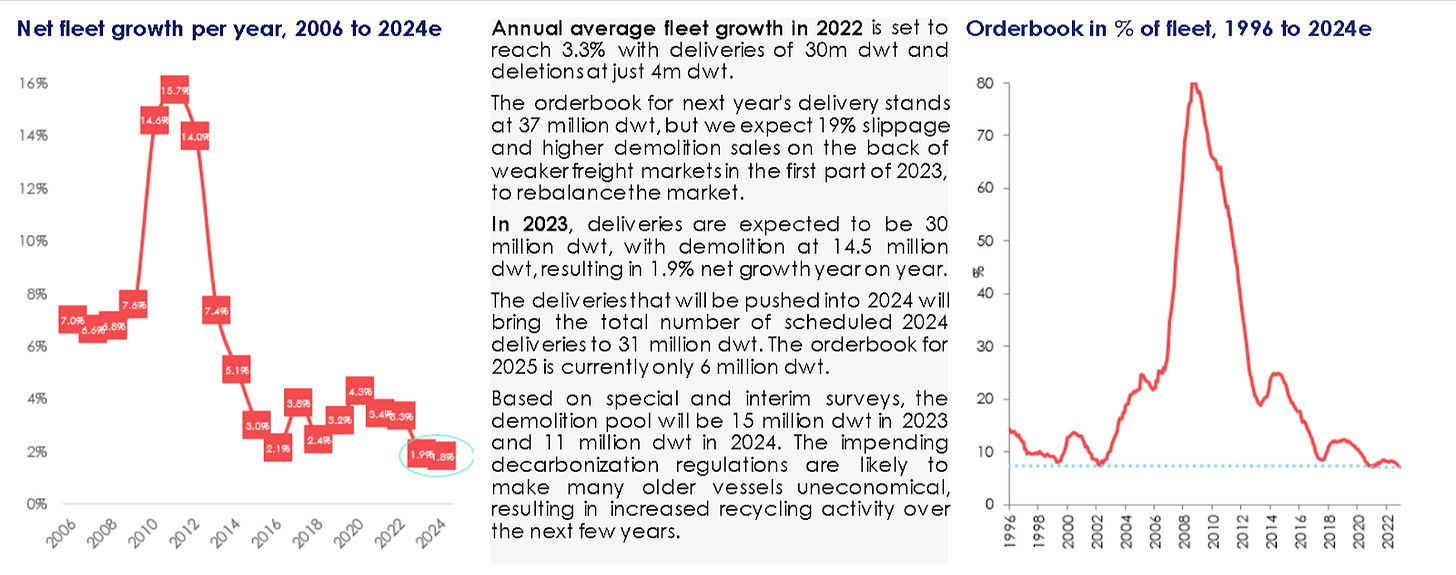
On the supply side, shipyard capacity continues to decline (Figure 13), the crude (Figure 14) and product (Figure 15) orderbook is supportive, and fleet growth is muted (Figure 16 - can’t find a chart for product, but similar story). Expectedly, scrapping remains limited due to high rates (Figure 17). Other shipping sectors, such as containers, are still ordering.
There are 2 interesting additional developments on the supply side.
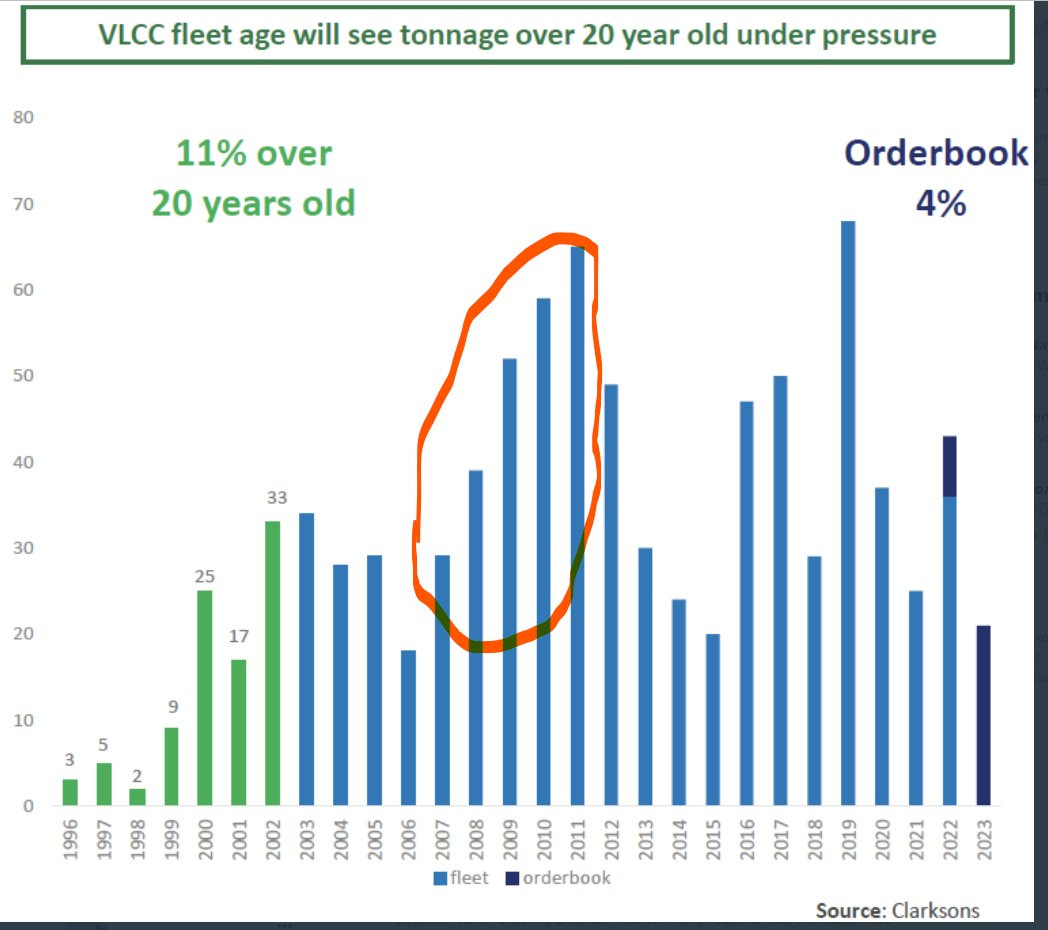
Firstly, from 2026 onwards (in an accelerating trend), a group of Chinese built ships, mostly VLCCs which some mentioned to be of a lower quality and shorter lifespan, may be scrapped, as they turn 20 (Figure 18 - red marked area shows Chinese ship glut). This is important because shipyards are filled through 2026 as of now, but this could put additional pressure beyond 2026.
Secondly, India is considering a ban on tankers over the age of 25, which would further reduce supply along the route to India, possibly the fastest growing user of oil in the world.
Valuation update
The outlook for both crude and product looks optimistic for the coming year, but the equities have also run recently. What do valuations look like now? There are divergences between the stocks, but I will just speak to $STNG and $TNP, my 2 primary holdings.
Scorpio Tankers ($STNG):
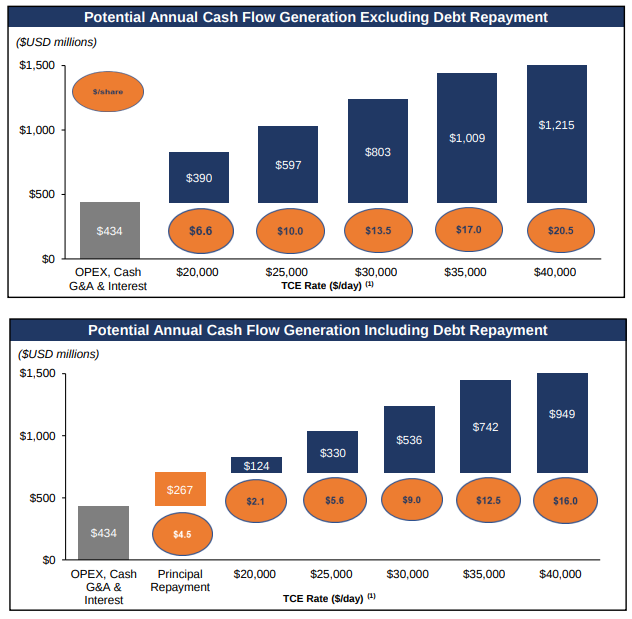
Scorpio Tankers is a product tanker company. Current market cap is US$2.84B, with share price US$47.87. As per my previous post in May 2022, assuming uniform rates of US$30k per day, Scorpio Tankers will generate US$9 per share of free cash flow after debt repayment. This rises to US$13.5 without considering debt repayment.
Rates for LR2s averaged US$36,700 per day as of Monday, less than half the US$88,100-per-day high in early December. Rates for MR product tankers averaged US$26,800 per day, down almost two-thirds from US$74,700 per day in early December.
So if that averages out to ~30k per day, $STNG trades at ~5.3x Price/EPS with debt repayment, and ~3.54 Price/EPS without. This isn’t as cheap as May 2022, but still fairly cheap. And I do think that product rates will rerate higher in the coming months. At US$40k per day, EPS will increase by 51% (Figure 19), cutting the above multiples to 3.53 and 2.35 respectively.
At least for just Scorpio, it looks fairly cheap.
$TNP:
$TNP has a market cap of US$496M with a debt of US$1.49B. It is a dirty tanker company with primarily Aframaxes and Suezmaxes.
When Baltic Dirty Tanker Index traded between 1300 to 1450 during June - September (currently 1300 with a peak of 2492 in December), the operating income was US$134M. Assuming the rates trade in the same range as last June - September, which I regard as reasonable looking ahead, the annualized operating income is US$536M, meaning EV/operating income ratio of ~4X, which is fairly cheap. The recent decline in dirty tankers has also hit VLCCs harder than Aframaxes and Suezmaxes, so $TNP may be even more insulated.
Overview
In my view, the supply side (which is the bedrock of the thesis) looks supportive, and there are demand side factors that will impact both dirty and product positively. The pullback in product rates has been strong recently but I believe the EU product ban and recovery of gulf capacity will lead to a recovery. Crude tanker rates should also see strong support from Chinese reopening. The main risk remains 1) a global recession, which would hit all segments (but this is insulated by the fact that we are so far below trend in global oil consumption, far more than in a conventional recession as per the 2008 financial crisis) and 2) a cessation of the Russia Ukraine war.
I’m mostly fully allocated, but if unallocated, I believe one can allocate a little to $STNG, $TNP, $OET and $NMM on pullbacks. I favor companies with financial leverage that are more sensitive to the upside. But I don’t see this sector as a screaming buy now. This post is a useful reminder not to buy into excess hype in this sector. During the last super-cycle, MR rates maybe hit an average of US$45-50k per day sometimes, and almost never hit US$100k per day. There’s no great Chinese expansion this cycle, so I wouldn’t say we would be able to outperform the previous cycle. High prices also prompt a market response, such as demand reduction (if one cannot build new ships, for example). Surprises, like the end of the war, can happen. So I would say peg a conservative rate, say US$40k per day for MRs, and ask if you would be comfortable owning a company at valuations implied by those rates.
Also note that the sector is very volatile, and we can see from the whipsaw of rates in the past year how inelastic things are and how fast they can change. Proceed with caution, and do not chase hype.
Dry bulk 2022 review
I know less about dry bulk, and it’s more complex due to the greater set of commodities it is correlated to, so I’ll keep my update brief.
Dry bulk was quite weak in 2022 (Figure 20).
I may not exhaustively understand all the reasons, but the lockdowns, especially in China, coupled with weaknesses in dry commodity weighted sectors like property (especially China) is a large reason.
Demand update
The main bull factor I see is the Chinese reopening. China is a huge % of the ton miles for dry bulk (Figure 21), especially iron and coal (Figure 22). As China reopens, I expect an increase in ton mile demand, although the exact extent may be affected by a general recession, a weakness in the property sector, reopening starts and stops, or the substitution of imports with domestic production (Chinese coal production has ramped up, for e.g.) etc. In December 2022, Chinese iron ore imports rose 5.6% YoY, but coal stayed flat. Overall though, going ahead, the reopening will lead to some level of increase in ton mile demand.
It is also important to note that trade routes may not be rerouting in an optimal way for dry bulk. The easing of the Chinese ban on Australian coal would compress the ton mile distance for coal imports.
There may be other unknown developments in the future, however, such as a ban on Russian commodities in the EU. A recent extension of the sanctions package banned investment by EU into the Russian mining sector, which would mean less Russian production and sales to EU. It could potentially portend deeper sanctions against consumption, not just investment, in the Russian mining sector. But I wouldn’t count on it.
Supply update
The supply side continues to look supportive, with a low orderbook (Figure 23) for the coming years. As per my research in Jul 2022, the fleet is also rather old (albeit still slightly younger than oil tankers, and the scrapping age is slightly higher).
Valuation update
My two main positions, $NMM and $EDRY, have not moved much since the last update in Jul 2022.
Summary
Overall, the supply side looks supportive, and the demand side is tightly correlated with Chinese demand, which should at least tepidly increase with the reopening. Overall, I wouldn’t say there isn’t any reasons to believe in a radical recovery now, but at the same time, rates are rather low even on a historical basis (Figure 24), asset values are low (Figure 25) and equity prices have gone nowhere.
I spoke before about antifragility and sectors that benefit from volatility. Dry bulk may exhibit this now. If the sector continues to do poorly, I expect scrapping to increase, and the orderbook will likely be squeezed out by tankers even into 2027 and beyond. Any positive surprises right now (and the shipping sector is full of them) would be well received from a fundamental and sentiment perspective. I’m happy to sit and wait till something happens (else a slow grind upwards over next few years is ok with me too), and add on further weakness.
Also note that my investments in dry bulk were also motivated by cheapness in $EDRY and $NMM, due to factors like illiquidity and distrust of management. The individual company valuations were equally important to the sector evaluations in my decision to invest.

