
Full steam ahead
Disclosure: I am a generalist, recently graduated retail investor who seriously entered markets in 2021. ALL of my research is borrowed from others (see references), I claim no credit for it, and merely intend to consolidate it for others to learn more about a sector.
I believe oil tanker sector prospects are set for a sustained period of improvement (basically “when, not if, and probably now” and market is seriously under-pricing it)
Contents:
Industry basics
What moves shipping equities: the shipping cycle
Supply
Demand
Summary and what can we expect going forward
How to play the sector: divergences between individual stocks
The bear case
Closing thoughts
References
Industry Basics:
Oil tankers are ships that transport oil. There are a few important traits when understanding tankers for the investment purposes:
Tankers can be crude (usually larger, ships unrefined crude oil from extraction point to refineries) or product (usually smaller, ships refined products from refineries to consumption point).
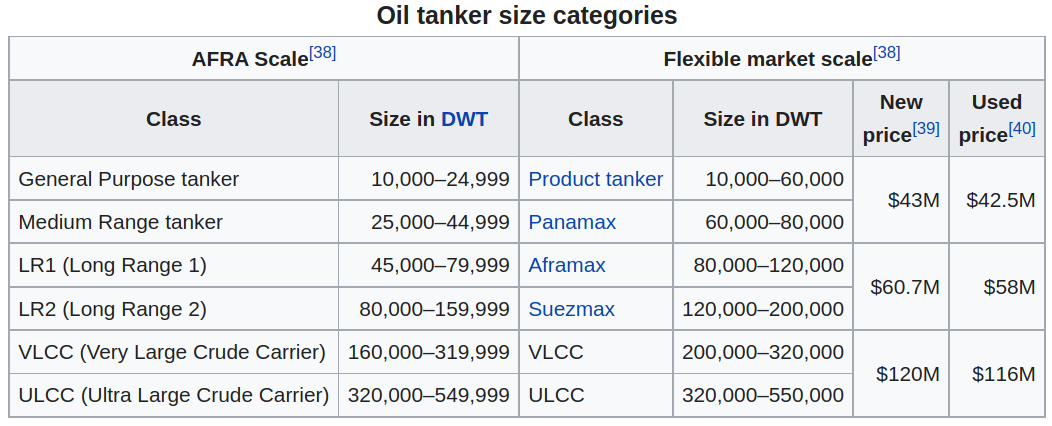
Tankers have different size classes:

Tankers are of different ages
Tankers can be equipped with scrubbers to remove harmful elements from exhaust
Tankers are a service, and the unit of that service is the ton-mile (transport 1 ton of oil for 1 mile).
Tankers operate along trade routes, which are characterised by length and width. Longer routes not only mean more ton miles, but not all ship classes are built for long haul (e.g. Medium Range). Trade routes width matters as not all routes are wide enough to accommodate all ship types (e.g. VLCCs cannot traverse Suez or Panama Canal).
What moves shipping equities: the shipping cycle
While there can be divergences between individual companies, generally, shipping equities tend to track the fortunes of the industry, doing well when rates are high and vice versa. There are 3 key things to understand about the industry: commoditization, cyclicality and inelasticity.
Commoditization: While factors like ship speed and ability to service specific routes provide some distinction, a ton mile is a ton mile. Shipping companies can do little to improve the product; with enough money, any company can buy the same ship and offer the same service. It is hence difficult to build a moat and most shipping companies are price takers for market rates.
Cyclicality: Crucially, the shipping industry’s fortunes are cyclical. Shipping companies order ships when prices and mood is high, increasing ship supply, depressing prices and mood, causing ships orders to fall off, current ships to be scrapped, supply to re-balance, and prices and mood to surge again. Even with this being common knowledge, companies continue to reinforce rather than contra the cycle. Harvard’s Robin Greenwood and Samuel Hanson studied 35 years of dry bulk ship prices (the lessons apply equally to tankers) and find that re-sale ship prices and new orders are highly and positively correlated with ship earnings (Fig 1 and 2). Ship buyers seem to treat current prices (low/high) as persistent when history suggests otherwise, buying/not buying at the worst times. Multiple factors may explain this: irrationality (extrapolation versus mean reversion thinking, herd thinking among CEOs), principal agent problems (empire building vs shareholder return), capital availability (excess capital at cycle peaks), etc. Overall, booms create busts and vice versa, and the traditionally the best time to enter shipping equities have been near cycle bottoms (Greenwood and Hanson show that ship owners who buy ships at cycle peaks historically earned returns as low as -36% while those who bought them at bottoms earned returns as high as 24%).


Inelasticity: As both shipping demand and supply are inelastic, these boom bust cycles can be extreme in both magnitude and length. Demand is inelastic because oil demand is inelastic, and transport fees are a small percentage of total cost of production of oil. For seaborne oil, demand is also inelastic as substituting ton miles involves changing production/refining locations, or building physical infrastructure, which takes time. Supply is inelastic as well. To build ships, you need shipyards, which take at least 2 years to build. An oil tanker also takes at least 2 years to build (longer now due to supply chain crises and shortages). This creates a situation where small shifts in demand and supply create large fluctuations in price that take a long time to resolve
For illustration, during the 2000s commodities boom, with rising demand from emerging markets (mainly China), there was a rise in demand for oil and oil tankers, causing VLCC rates to spike as high as 90000 (Fig 3).

Likewise, the supply shock in the 2019 trade war that sanctioned 5% of the VLCC fleet from COSCO, and demand shock in 2020 for oil storage for excess oil during Coronavirus led to VLCC rates spiking sharply (Fig 4).

So where are we currently in the shipping cycle? A TLDR of events, which we will go into deeper detail in later sections:
The 2000s commodities boom led to massive ordering of new ships, causing rates (Fig 3) and ordering to fall drastically, and fleet age to increase (Fig 5)

Figure 5 The 2019 trade war led to sanctions on COSCO, spiking tanker, especially VLCC rates (Fig 4)
The 2020 coronavirus caused oil demand to fall drastically, and excess oil that could not be stored on land had to be stored in tankers, spiking rates (Fig 4)
As oil supply fell and excess oil was worked off, demand for tankers fell, causing tanker rates to crash (Fig 4)
Recovering oil demand from reopening, coupled with rerouting of oil trade due to the Russia Ukraine war led to tanker rates recovering in some segments.

Supply
Tanker industry prospects are about supply and demand. We will first address the direction and rate of change of supply, then demand, before putting that together to analyze tanker earnings going forward.
The main conclusion of this section is that supply of ton miles is entering a period of sustained decline, which would lead to higher rates and earnings.
Ton-miles = number of ships x ton-mile output per ship. Ship numbers are controlled by inflows and outflows. Inflows are new ships that were ordered and are entering service, while outflows are basically ships that are being scrapped (steel in tankers is recycled for scrap metal).
Inflows depend on the willingness of ship owners to buy new ships and the ability of shipyards to service that demand. Ship owners generally buy ships when capital is available, times are good and they expect (reasonably or not) that they will earn a return on ships higher than the price paid for them. With tankers in a multi year bear market (low earnings, deteriorating valuations and financial health) and low expectations due to the large supply overhang and periods of depressed demand, orderbooks across multiple ship segments are on the low to middle range up to 2020 (Fig 6). Depressed rates due to depressed oil demand from lockdowns pushed the trend continuing into May 2022 (Fig 7):


Coupled with depressed demand for ships in the past few years, even more dismal is the capacity to accommodate ship orders, meaning that even if rates rose, ship owners would not be able to kill the nascent bull market by ordering more ships.

Shipyard capacity has declined more than half in the past decade, with 682 shipyards in 2008 reduce to 275 in 2022. (Fig 8) And it will decrease further. Many second tier yards are unable to build the modern designs and sizes required. 129 second tier yards that delivered a ship in 2021 did not receive any new orders in 2021. Furthermore, shipyard capacities are already full and servicing other shipping segments, primarily the container/LNG market that has enjoyed a boom in recent years (Fig 9). The orderbook falls off a cliff 2023 onwards, whilst shipyards are already full through 2H-2025 (Fig 10).


A supply response would require a recovery in shipyard capacity and reallocation of that capacity to servicing oil tankers. The boom in container ships does not appear to be ending yet, with container rates remaining high, and attractive charters for July 2023 onwards are still being signed. This means competition for shipbuilding slots from other segments is likely to continue (Drybulk is ascendant and likely to increase orderbooks when able, Nordstream shutting down likely means more LNG carriers will be needed to service Europe and rates stay high). As for capacity recovery, ship ordering lags rates, ship deliveries lag orders for >2 years, and new shipbuilding capacity lags years after that. We would likely wait more than 5 years for any significant supply side response. As a case in point, despite persistently high rates in the boom starting 2003, the slowness of supply response led to 7 years of high dry bulk ship earnings (Fig 11). Same lessons apply to tankers.

With low rates having suppressed demand and new demand capped by yard capacity, new demand is likely to be dampened by environmental regulations as well. Under IMO 2020, new ships have to either burn low sulphur fuel or install a scrubber to burn high sulphur fuel. Low sulphur fuel is more expensive and scrubbers cost money. A scrubber on a VLCC can cost 8m (standard VLCC costs ~100m). This is part of a broader ESG movement which could impose regulations that make ships less economical. A proposed carbon and fuel tax could force ships to slow-steam (move slower to save fuel costs, reduce emissions), reducing ton-mile output per ship and making them less economical. With regulatory headwinds, ship companies are likely to be cautious in ship ordering in the coming decade.
Moving on from inflows, we will now discuss outflows. Ship numbers decrease when they are scrapped for steel, which happens when vessels are uneconomic and scrapping prices are attractive. Scrapping accelerated in 2021 and looks to maintain its pace due to the aging of the fleet, environmental regulations, and high steel prices. A further tailwind may be cessation of the Iranian and Venezuelan illicit oil trade.
Ship economics rapidly deteriorate as they enter the late stages of life (~20 years). Ships are heavily regulated and need to be surveyed constantly. The surveys cost more as ships age (1.5m for 5 yr old, 4m for 20 yr old and increasing beyond, Fig 12). Operational efficiency decreases with age, with utilisation falling off quickly past 15 years of age (Fig 13). Old ships predate environmental regulations, and may be less fuel efficient, do not have scrubbers and may not even be able to retrofit them. Even if they could, the ROI for retrofitting an end-of-life ship is low. The tanker fleet is aging, with average fleet age at multi decade highs, 25% of VLCCs >15 years (Fig 14) and 25% of the entire fleet >20 years by 2023.


Furthermore, inflated steel prices have led to high scrapping prices (Fig 15). While these prices may reverse in the future, due to under-investment in commodities, they are likely to remain elevated relative to historical norms.

That said, environmental regulation and high prices do not guarantee high scrapping. Scrapping levels were very low in 2019 and 2020, due to the temporary rate spikes and hopes for a quick Covid recovery. However, as rates turned down and lockdowns continued, scrapping accelerated, with 2021 levels as of Dec 2021 greater than both previous years combined (Fig 16). In the coming years, pressure from vessel age, environmental regulations and scrapping prices will mean higher and higher rates will be required to keep the fleet afloat.

A wild card is the scrapping of the fleet used in the shipping of sanctioned oil from Iran. 8% of VLCCs and 5% of Suezmaxes, which are non-eco, >20 year old ships, are engaged in the illicit trade of Iranian and Venezuelan oil. They are viable only because of the premiums in the black market, otherwise they would be uneconomic and scrapped. If a deal with Iran is reached, and it seems like pressure is mounting, this could clear out further overhang from the market. There have been hopes for a relief on Venezuelan oil, although this is still largely speculation.
Combining the analysis of both inflows and outflows, the number of tankers will almost certainly decrease in the coming years as fleet renewal potential goes significantly below 1.0 (Fig 17).

Not only does the actual number of ships look to decrease, the ton-mile output per ship is likely to decrease in coming year, as the fleet continues to age and average vessel utilisation decreases (Fig 15). Environmental regulations will also force many ships to slow-steam, removing an estimated 1-2% in tanker fleet capacity.
Overall, both the number of ships as well as output per ship look to trend downward sharply, severely impacting global ton-mile supply.
Demand
Having analyzed supply, what does demand for tankers look like going forward?
The main conclusion of this section is that demand of ton miles is inflecting upwards due to structural trends and recent events, which would lead to higher rates and earnings.
Demand for oil tankers is dependent on two things: 1) demand for oil and 2) trade patterns in oil.
Demand for oil tends to grow about 2% annually, a persistent trend due to global GDP growth (Fig 18). The green transition will take time, is oil intensive, faces headwinds from commodity shortage and will be unlikely to offset the growth in global wealth and energy consumption from emerging markets. Meanwhile, as the world reopens, oil consumption will increase anywhere from 1-3 million barrels (although admittedly OPEC+ has missed some targets). This would have a significant impact on tanker demand. Assume 1.5m incremental barrels (conservative) from ME to China as it reopens, that is completely seaborne (ME oil is shipped, not piped, to China). A VLCC holds 2m barrels of oil. We will thus need 1 additional VLCC per day. The average round trip from the gulf to China takes 55 days, translating into 50+ extra VLCCs, against a total fleet of 800 VLCCs.

Layered on top of this recovery is a shifting of trade patterns.
First, the redirection of Russian oil from Europe to Asia due to sanctions from the Russian-Ukraine war could greatly increase crude ton-mile demand. Almost half of Russian oil exports goes to Europe (Fig 19). With European sanctions, crude from Baltic and Black Sea could go to Asia instead (recent news suggests this to be so). How to quantify the impact? ~1.3 million barrels are carried via Aframax from Russia to Europe, a trip that takes 1-2 weeks. If this oil goes to China and India, Aframaxes will have to move to dedicated ports to offload to VLCCs (Russian ports cannot service VLCCs). Aframax demand will remain unchanged. The round trip for VLCCs to Asia is several months, and is convertible into roughly 80 VLCCs of incremental demand. And this only includes seaborne crude. Any redirection of landborne crude will translate directly to seaborne crude as physical infrastructure does not exist for alternative routes. Even with higher prices and demand destruction, ton-miles is likely to greatly increase.

Secondly, the Russian Ukraine war has exacerbated the impact of declining European refining capacity and rising Asian capacity on ton-mile demand. European refineries have been in structural decline (worsened by loss of Russian refining from the war) whilst APAC and ME refining capacity is expanding. Chinese refineries remain underutilized. As the diesel crisis in Europe worsens and North American refineries max out, Chinese refineries will likely make up the difference, increasing crude ton-miles to carry oil to China for refining and product ton-miles to carry refined products back. How to quantify this? In 2021, Europe imported 2.2M b/d of crude and 1.2M b/d of products from Russia. If even a fraction of that crude must go to China and come back as product, this could easily lead to increase in tens of VLCCs and corresponding product demand.
Reopening oil demand, coupled with a war that has shifted existing routes, mean that crude and product ton-mile demand is likely to increase in the short to mid term. While the route analysis has mostly focused on the European situation, it is primarily because it has experienced the highest rate of change due to the war. Routes will continue to shift around the world, but the effects will take longer to play out. An analysis of that is beyond the scope of this article.
Summary and what can we expect going forward
To summarise the above:
Supply of ton-miles looks to fall: Number of ships looks to decrease as orderbook falls off through 2025. Regulations and recent emergence from low rate environment discourages ordering, while orders cannot be fulfilled even up to 2027 due to severe shipyard shortages. Regulation, fleet age and scrapping prices will likely lead to increased scrapping in coming years. Ton-mile output per ship will also likely decrease due to fleet age and regulations.
Demand for ton-miles looks to rise: Oil demand recovery will increase ton-mile demand. VLCCs will particularly be impacted due to their role in shipping oil to China, which is a huge oil consumer still pursuing zero Covid. Redirection of cheap Russian crude (seaborne and land) from Europe to China will greatly increase ton-miles. If Chinese refineries are tapped to service European refining shortfall, this will increase both product and crude rates as crude goes east and back as product.
How high can rates go? When US sanctioned the COSCO tanker fleet totalling ~70 VLCC equivalents of capacity in Sept 2019, it quickly sent VLCC rates from $30K to nearly $300k per day (Fig 20). While the fleet is larger today, and $300k was not the average rate, simply looking at demand alone, above calculations show increased demand for 100+ VLCCs is not out of the question. Coupled with a dismal supply picture that almost guarantees the ton-mile supply to fall, I think prices are headed a lot higher and staying higher as supply cannot respond.

What would this mean for equities? Comparing current to past share prices for tanker companies would be misleading as many companies diluted heavily during the bear market. Historical market cap comparisons are also not appropriate as many companies have changed, such as expanding their fleet size. Instead, we can get an estimate of how cheap stocks are by comparing current market cap to earnings and asset values. We look at Scorpio Tankers and Euronav:
Scorpio Tankers: Specialises in Product Tankers. 1.71B market cap, share price $28.79 as of 17 May 2022. Average fleet age ~6 years, all scrubber equipped. Fleet consists of 14 HM, 62 MR, 6 LR1, 44 LR2.
While rates can vary on many factors like charter length, Scorpio reported LR2 rates of 24k per day, MR and HM rates of 30k per day as of April 27, 2022. Clarkson Platou is reporting rates of 50k per day for modern MRs in Apr 2022. Tradewinds is reporting rates of 50k per day for LR2 in Apr 2022.
Assuming uniform rates of 30k per day, Scorpio Tankers will generate $9 per share of free cash flow after debt repayment, meaning ~3.2x Price/EPS post debt repayment. This rises to $13.5 and ~2.13x Price/EPS without considering debt repayment (Fig 21)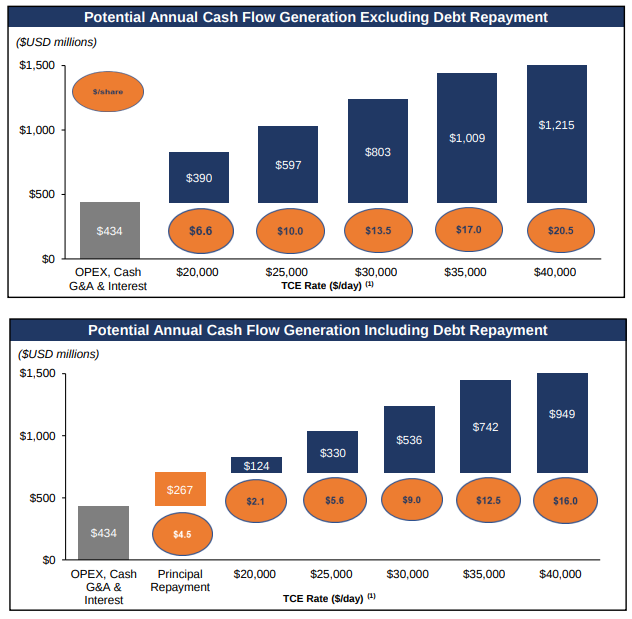
Figure 21 Their asset value is also significant. Scorpio tankers sold 2 2013 built MRs in Jan 2022 (pre war, note) for 23.5M and 34.9M, and 12 LR1s for average 34.5M. Even if we just valued the MRs with an average price of 20M, you are looking at an asset value of 1.24B.
This is all coupled with product tankers actually having the lowest orderbook among tanker segments at 4% of total fleet, which will probably squeeze both rates and secondhand vessel values in the future (20.7% of vessels older than 17 are scrapped).Euronav: Specializes in Suezmaxes and VLCCs. 2.3B market cap, share price $11.32 as of 17 May 2022. Core fleet (owned by them) age ~7 years. Core fleet consists of 38 VLCCs, 28 Suezmaxes.
Crude rates have lagged product, with Euronav reporting 13.6k per day for VLCCs and 15.5k per day for Suezmaxes in Q1 2022, but the shortfall of ~70 VLCCs during the COSCO sanctions spiked rates up to 300k per day, stabilising at 96k per day. The shortfall is expected to be more severe and lasting in the coming years. Assume 50k per day for VLCCs and 35k for Suezmaxes (50k per day is below the 1 year time charter rate for all years 2005 - 2010, during the last boom), and taking Euronav’s reported breakevens of 22k and 17k for VLCCs and Suezmaxes respectively, we generate earnings of (50-22)x38x365+(35-17)x28x365) = 572M from Euronav’s core fleet of 66. In addition to that, they opportunistically lease ships (8 as of now).
This gives a PE ratio of ~4, with a long term debt of 1.5B, cash position of 0.17B, and long term asset values of 2.85B (mainly their vessels, and this could be accounting underestimation. Some say true value is closer to 3.8B).

Thus, comparing share prices to potential earnings and asset values with reasonable assumptions, the sector is still cheap and has significant upside. And there’s no telling what the market is willing to price in if the sector moves into euphoria.
In an upswing for a cyclical industry though, share prices could go up many multiples. An example is the container market.
Maersk went up 5x from Covid lows:

ZIM went up 7x in 1 year 3 months:

Note that the PE ratio of ZIM is 1.61 at $62.39 as of 17 May 2022, below the peak of $84.5, and pays a dividend yield of 32%. These stocks are still be regarded as deep value, providing downside protection, and arguably should be even higher, demonstrating the power of catching boom bust shipping sectors at an inflection point.
A note on caution for shipowners on valuation metrics
A common valuation used for shipping owners is Price/Net Asset Value. People will tell you a stock trades at a discount to NAV. If you are a private shipowner, you can just sell all the ships and profit. So for public investors buying at a discount, we can’t lose right? Wrong.
Suppose a company has 50 vessels. Usually, private shipowners can run a ship for $1k/day, while a public shipping executive will charge $2k/day because they charge high management fees. Let’s say they make 50M a year. Due to the $1k/day increment, we lose 50 x 365 x 1000 = 18.25M a year. So a 18.25/50 = 36.5% discount is fair as the earning value of public ships is lower due to expenses.
Hypothetically, if we sold all ships and returned money to shareholders, sure we will make money. But remember shipping executives want to keep their job (and they need ships to do that), and the incentives are not always aligned. And beyond the 36.5% discount above, management can layer on all kinds of “costs” to rob shareholders. So discounts of even 60% are not uncommon.
Furthermore, shipping companies are usually heavily indebted, so Enterprise value/NAV may be better reflective of asset value relative to claims on the firm.
All in all, do not use simplistic measures like Price/NAV in a vacuum to evaluate stocks. Evaluate if the multiple is justified, and rely on the inflation in asset value rather than the multiple.
How to play the sector: divergences between individual stocks
I don’t know the sector well enough to espouse deeply on individual names, but a few themes have emerged and I’ll sum up some bull cases some experts have on specific names:
Highly levered companies do poorly if rates persist at low levels, but if rates rise imminently, then their leverage turns into out-performance.
$TNP has a market cap of $322M with a gross fleet value of ~$2.5B as of 17 May 2022. At April spot rates, a Aframax and Suezmax operator like $TNP makes its entire market cap in FCF in a year. - check out @AllVentured on Twitter as he is long $TNP. The owner is shady and dishonest, however.
$STNG also has high debt levels, is printing cash and looking to aggressively paydown debt.Unsure if VLCC operators are still pricing in old VLCC rates, but with Chinese reopening, refining shifting east and the massively aging VLCC fleet, VLCC rates will soon catch up.
Look up a company’s fleet, and check for exposure to VLCC. Euronav, for example, has significant exposure. Check for valuations and see if they are skating where the puck is going.Buy companies with young, eco-equipped fleets, due to their operational efficiency and because their asset value will greatly appreciate in coming years due to regulation and sustained shortages.
$OET has a large eco-fleet - check out @OriginalBraila on Twitter as they are long $OET. For a bunker fuel cost of $900/t, $OET estimates savings of $13200/d for eco tankers. Fuel prices track oil prices and look likely to sustain for the future.
$STNG has a young and scrubber equipped fleet. Note that eco savings are more modest for smaller tankers such as MR vs VLCCs that burn more fuel (Currently $3000/d for US to Europe Atlantic route)If risk averse, buy companies with a margin of safety with low breakevens that can make money even with low rates, to insure against a decline in rates
$HAFNIA comes to mind.Cheap.
Someone said $TNK was cheap, so I bought some.
The bear case
Feeling bullish? There are still things that can go wrong. I would break them down into market and sector risks and address each in turn.
Market risk: With inflation fears and the Fed turning hawkish, equities are selling off sharply, and whilst tankers have shown tremendous relative strength, if a selloff worsens, I do expect tankers to be capped or selloff together with other equities.
How I would address this: There’s really nothing original I can say about market risk, except that this is a volatile sector, so leverage could turn volatility into risk. Use no to minimal leverage, the sector already has enormous torque. And leverage can be obtained implicitly through specific plays (e.g. levered companies) rather than financial means, which is a smarter way to increase torque. Valuation risk is real, and note that the container stock charts above benefited from Fed largesse, so moderate one’s expectations.
Supply is much more transparent, at least through 2025, due to visibility of the order book for many years out. The primary sector risks I see are on the demand side.
Sector risk (Global recession): A global recession would reduce economic activity and reduce oil demand.
How I would address this: Oil demand is quite robust to recessions. The Coronavirus is unique in restricting physical movement. Oil demand fell 8.66% from 2019 to 2020. However, in the GFC, oil demand fell 2.9% from 2007 to 2009, recovering fully by 2010. Rates may stay low for awhile, but it is unlikely to be as catastrophic as the pandemic.
Sector risk (Chinese recession): Similar to above is a severe depression in China and unreasonable perpetuation of its zero Covid policy.
How I would address this: I would address it the same way as the above point, with the added caveat that VLCCs will be disproportionately hit and one should diversify. That said, VLCCs are already suffering from zero covid and might be pricing in some of this pessimism already.
Sector risk (Failure for oil production to increase): This is a giant topic, but the world is facing an energy shortage while several oil producers like OPEC and US shale are failing to hit production targets. This means less oil shipped and less tanker demand.
How I would address this: Production misses would mean high prices and investment will at some point will close the shortfall. High prices means insensitivity to high tanker rates. Furthermore, shortfalls lead to desperate sourcing of fuel from unconventional sources, incremental demand of which is almost 100% seaborne and accretive in ton mileage (e.g. sourcing Nigerian crude, tapping Chinese refining). Not necessarily bearish.
Sector risk (Sanctions on vessels carrying Russian oil): Countries could sanction all vessels dealing with Russian oil. Ports could refuse to service Aframaxes loading Russian crude into VLCCs bound for Asia, and product tankers shipping refined Russian oil from China.
How I would address this: This would lead to catastrophic oil prices and it is unlikely there is political will to carry this through. Russian crude at insane discounts may find its way East by any means necessary, utilising vessels that may not be built for long haul at very high prices to go East. Product ton mileage could increase as Europe sources desperately for oil from distant regions.
How I would address demand side concerns in general: It is key to understand the psychology of ship owners and shipyards. If low rates continue and pessimism reigns, with fleet age at multi decade highs, you will likely see unprecedented levels of scrapping. Orderbooks will remain low, and capital investment for shipyards further delayed. Demand will return someday, but the longer it takes to do so, the more dismal the supply side gets. The bull market will be delayed, but intensified. As for concerns about different performance between different tanker segments, it is important to note that most oil tankers are substitutable to some extent, and so for the long term, an aggregate view may be sufficient.
Sector risk (Punitive regulations): Environmental restrictions, taxation on oil tanker profits, etc.
How I would address this: Again, it worsens the supply side, and because I believe we are entering a seller’s market, tanker owners will be able to pass on costs to consumers.
Sector risk (Changing in refining/production locations): Trade patterns could change over the long term, for example increased ME refining capacity substituting Chinese and reducing ton-mile demand for product from China.
How I would address this: I’m here for a good time, not a long time.
Closing thoughts
While the setup looks bullish, do take note that tankers are volatile and fraught with operational and geopolitical risks. No one could have predicted COSCO sanctions, the Coronavirus or the Russia Ukraine war. Something could blow up, like the Suez Canal, or the Chinese economy. That said, downside protection is afforded by how dismal the supply situation is, and demand shocks are likely to be temporary and only worsen the supply situation, thus delaying and intensifying the bull market. One could regard the tanker market as anti fragile at this point in time. As a hedge, it may be wise to diversify across tanker segments, and to avoid leverage through financial leverage, which could convert volatility into risk.
Also, do note that recent improvements in fundamentals have increased optimism, and may be partially priced in. In my opinion, not enough.
Ultimately, DYOR. I’m just some dude on the internet. Caveat Emptor.
Disclosure:
I am personally long 17.5K $STNG @ cost basis 14.56, 6.4K $TNK @ cost basis 10.81, 2.4K $NAT @ cost basis 1.83, 7.6K $TNP @ cost basis 10.91.
References
100% of the content here is taken from:
@AllVentured (https://twitter.com/AllVentured)
@calvinfroedge (https://twitter.com/calvinfroedge)
@OriginalBraila (https://twitter.com/OriginalBraila)
@ed_fin (https://twitter.com/ed_fin)
@joeriwestland (https://twitter.com/joeriwestland)
@Stockaholic5 (https://twitter.com/Stockaholic5)
Stokaholics (https://www.youtube.com/c/Stockaholics)
Mariusz Skonieczny (https://www.youtube.com/user/SkoniecznyMariusz)
Verdad Capital (https://verdadcap.com/)
Another nice summary, thanks.
I would say the Russian sanctions risks a significant addition to the illicit tanker pool, and hence more delayed scrapping. Since Russian ports can't accommodate VLCCs, I also wonder if that adds doubt to the "China reopening means higher VLCC demand". But maybe they do the at sea transfer to VLCC thing since it is such a long haul, dunno.
In your valuation section you mostly rely on PE. I would say that metric is mostly ignored in shipping. P/NAV is the most popular, where NAV base is fleet market value. Adjust for discounted future earnings/dividends if it pleases you.